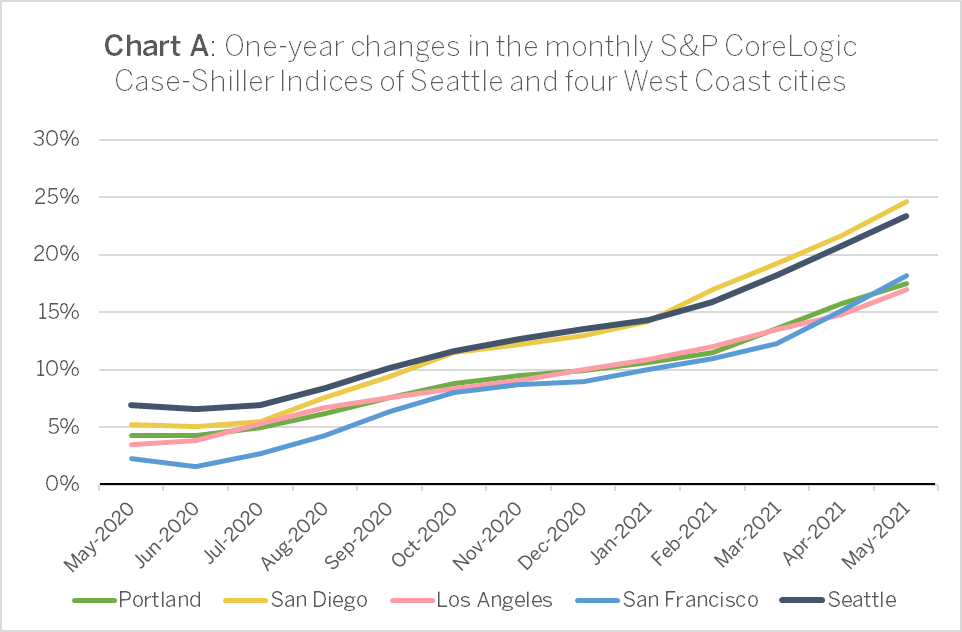
Buyers, sellers, and even some brokers may be alarmed upon reading that in May 2021, the CoreLogic Case-Shiller Home Price Index[1] for Seattle reached a stratospheric 23.4 percent year-over-year gain. The appearance (if not reality) of residential prices increasing by half a percentage point weekly would make a highly uncertain endeavor of pricing and negotiating the sale of a property. So in this month’s report, we will take some time to explain how the index is computed, and what the implications are for homes in Seattle and throughout western Washington State.
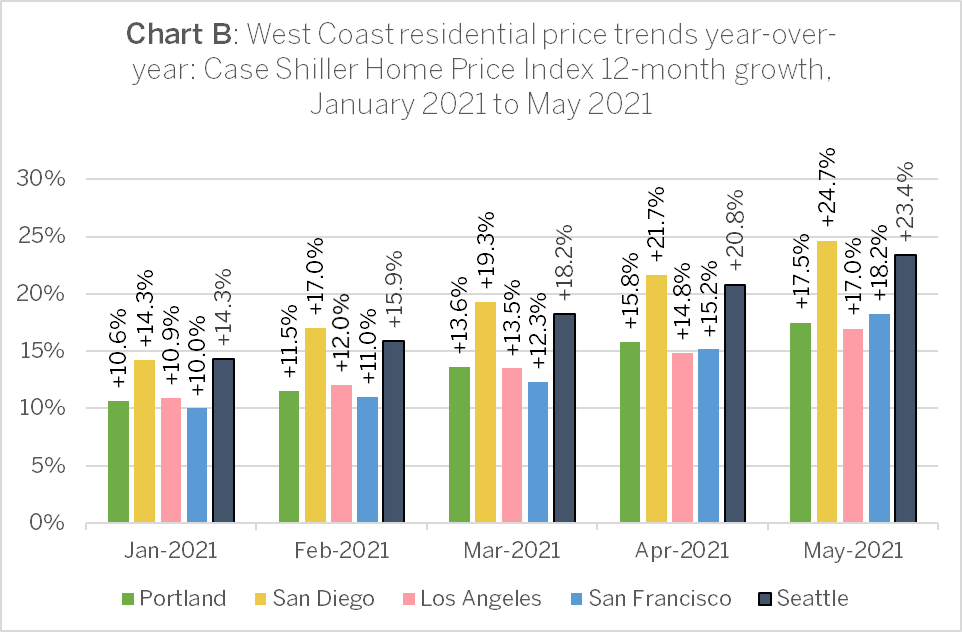
S&P Dow Jones reported the Case-Shiller Index showing Seattle remaining in third place nationwide, following San Diego and Phoenix as it has since last year. The index registered double-digit residential price advances in all 20 reporting cities, with even laggard Chicago achieving 11.1 percent growth year over year. The three leading cities all exceeded 20 percent for a second month, with Phoenix at 25.9 percent growth year over year, and San Diego at 24.7 percent. Other West Coast peer metros trailed: San Francisco with an 18.2 percent increase, Portland at 17.5 percent, and Los Angeles at 17.0 percent year over year (Charts A and B).
In describing these results, Craig J. Lazzara, Managing Director and Global Head of Index Investment Strategy at S&P Dow Jones Indices, found himself “running out of superlatives.”
The 16.6 percent gain is the highest reading in more than 30 years of S&P CoreLogic Case-Shiller data. As was the case last month, five cities—Charlotte, Cleveland, Dallas, Denver, and Seattle—joined the National Composite in recording their all-time highest 12-month gains. Price gains in all 20 cities were in the top quartile of historical performance; in 17 cities, price gains were in top decile.[2]
Case-Shiller methodology: what it means for buyers and sellers
As we have explained in previous reports, the Case-Shiller home price index expressly excludes new construction, as well as all kinds of dwellings that cannot be categorized as single-family residences. What we have not previously covered in detail is the Case-Shiller methodology, which is essential to any speculation about what has been happening to the index this year (2021).
The index is not just an average or median of all recent home prices paid. It is based on “sales pairs,” sequential selling transactions of the same home:
For each home sale transaction, a search is conducted to find information regarding any previous sale for the same home. If an earlier transaction is found, the two transactions are paired and are considered a “repeat sale.” Sales pairs are designed to yield the price change for the same house, while holding the quality and size of each house constant.
This is how the economists at S&P Dow Jones aim to circumvent the problem of comparing apples and oranges: by compiling multiple instances of sequential selling price changes for the same homes over a period of years, and then aggregating them with all other sales pairs into a monthly index based on the changes of the target month and the preceding two months.
However, even by using sales pairs for each single house, differences necessarily remain. A common interpretation of the index results is to assume that they indicate uniform price movements of dissimilar properties within the geographic area covered by the index. This interpretation reflects both the fallacy of division—the notion that something that is true for a whole must also be true of all or some of its parts—as well as a misinterpretation of the Case-Shiller methodology. S&P Dow Jones have attempted to control for those differences: secondly, by partitioning the results into low-, middle-, and high-tier trends; but firstly, by underweighting certain kinds of sales pairs.
Categories of sales pairs subject to underweighting include: (a) those with price anomalies that indicate a significant positive or negative change in valuation of a kind that would be reported by appraisal, or by a recording error in the prices; or (b) sales at such a longer interval as to presuppose a substantial change in value. Sales transactions in a third category, at (c) a frequency of turnover of six months or less, which might indicate a less-than-arm’s-length transaction, fraud, or redevelopment of a property, are excluded from calculation of any index.
Importantly however, the criteria that cause a sales pair to be underweighted, unlike those involving high turnover frequency, do not cause these sales to be excluded from the computation. In times such as ours, one of very low inventory and comparatively fewer transactions relative to trend, the exclusion of high frequency sales and the overall paucity of transactions will lend greater substance to even the underweighted categories of sales pairs. If many of those pairs happen to be of homes among our most affluent neighborhoods, the effect should be to pull prices higher.
S&P Dow Jones does not publish their source data. “While the indices are intended to represent all single-family residential homes within a given MSA [metropolitan statistical area], data for particular properties or component areas may not be available. Performance of individual properties or counties is not necessarily consistent with the MSA as a whole.”
So we have no immediate way of testing our hypotheses: that the Case-Shiller Home Price Index might be influenced by a surge of high-end urban homeowners attempting to unload properties which are at multiples of the median price for the MSA subject to a given index; or that sufficient numbers of such sales will cause the index to rise even if those properties are sold at a discount from their sellers’ expected values. Of course, the index tells us nothing about demand factors, such as whether changing work-from-home policies have raised the incentives for such sales, as facetime requirements of executives and highly skilled workers have been consequently reduced. But these possibilities are worth considering; and together with familiar conditions such as low inventory and low mortgage interest rates, would partly explain why prices have risen by such historically outsized percentages.
This is not a critique of the Case-Shiller index or its methodology. The index simply tells us whether residential prices are increasing and by a reasonable estimate of how much. The reported index values and changes do not show us in which geographic directions demand may be shifting inside the MSA’s boundaries, although it seems possible for these shifts to be detected within the Case-Shiller source data.
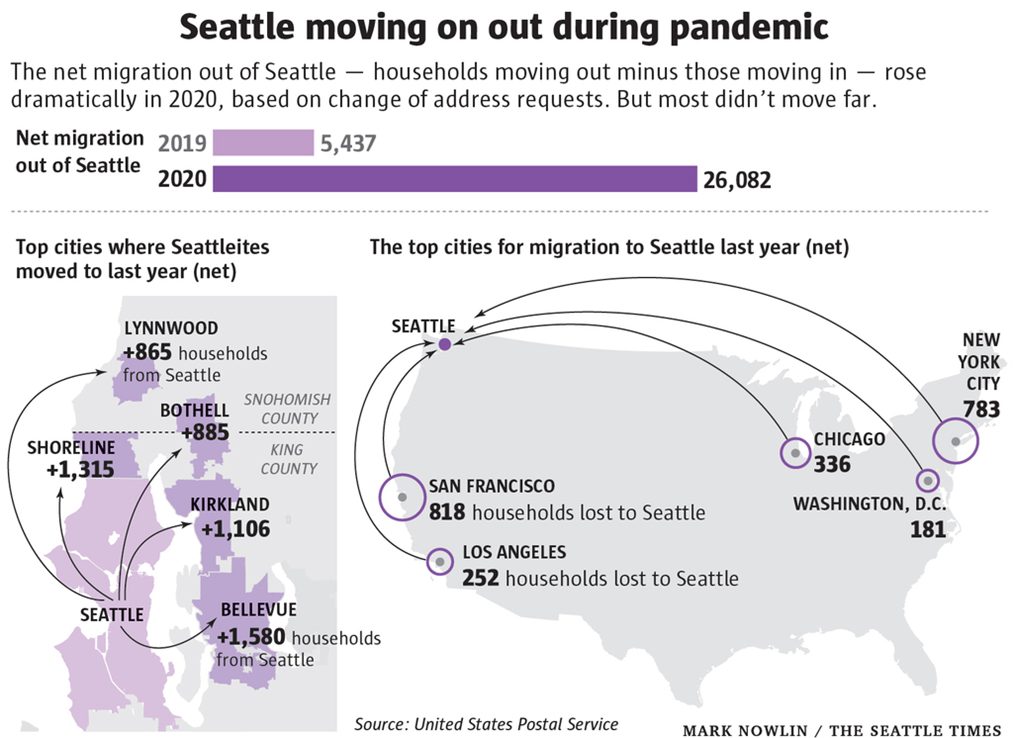
Since September 2020, S&P Dow Jones themselves have been telegraphing that their data show moves from urban centers to the suburbs, always with the caveat that further analysis would be needed to prove or disprove this hypothesis. That proof has come with more recent reports from the Federal Reserve Bank of Cleveland, [3] and most recently, by the FHLMC (“Freddie Mac”).[4] A February 2021 report by Danny Westneat of the Seattle Times demonstrated relocations within the Seattle MSA by means of postal service relocation data (see Seattle Times charts below).[5]
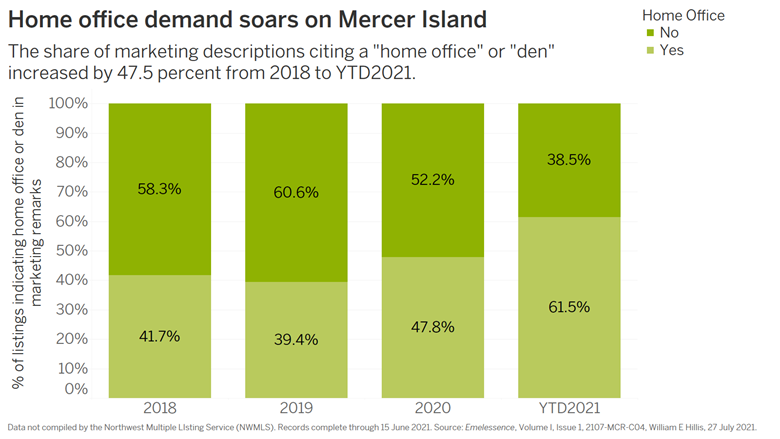
The Freddie Mac report confirmed the rapid acceleration of a longer term trend reported by RSIR—since 2018, urban commuters had been soaking up inventories in progressively more remote exurbs. In 2020, changing work-from-home policies under COVID-19 allowed them to convert these homes to workplaces. Proof of this shift has been found in abruptly increased mentions of “home office” and “den” in the marketing descriptions of properties for sale throughout the Puget Sound region. (For an example from Mercer Island, see Chart C below.)
Another indicator: selling price deviation from listed prices
More evidence of a sense of urgency among urban sellers can be detected in the changing proportions of price discounts from listings to sales. With historic and persistent low inventories, buyer competition has been a recurrent theme in Puget Sound markets for the past five years. Tales of bidding wars are so widespread as to instill confidence in sellers at every level that they could name their price and sell with little negotiation.
Seller’s urgency does not necessarily imply concerns about COVID-19 or political unrest. For years it has been predicted that aging Boomers would be pressed to downsize after 2020 (the “Silver Tsunami”), exchanging larger homes for condominium units or assisted living. [6] Recent signaling by the Federal Reserve and Freddie Mac earlier this year that mortgage rates would be rising may have persuaded some of these owners that their proceeds would be maximized if they sold immediately.
Chart C: Mercer Island working space remarks in marketing descriptions
Selling price deviation from listed prices does not tell us much about the actual value of the homes offered for sale, or even what the sellers think their homes are worth. However, it does tell us something about the seller’s eagerness to close a deal, and at what percentage discount from the offered price as needed. When aggregated and compared with home sales at other prices and in other geographic areas, these data give some notion of which areas are seeing exits, and which are seeing demand from new arrivals. As such, they might complement other data on relocations, such as the postal service relocation notices informing Westneat’s report.
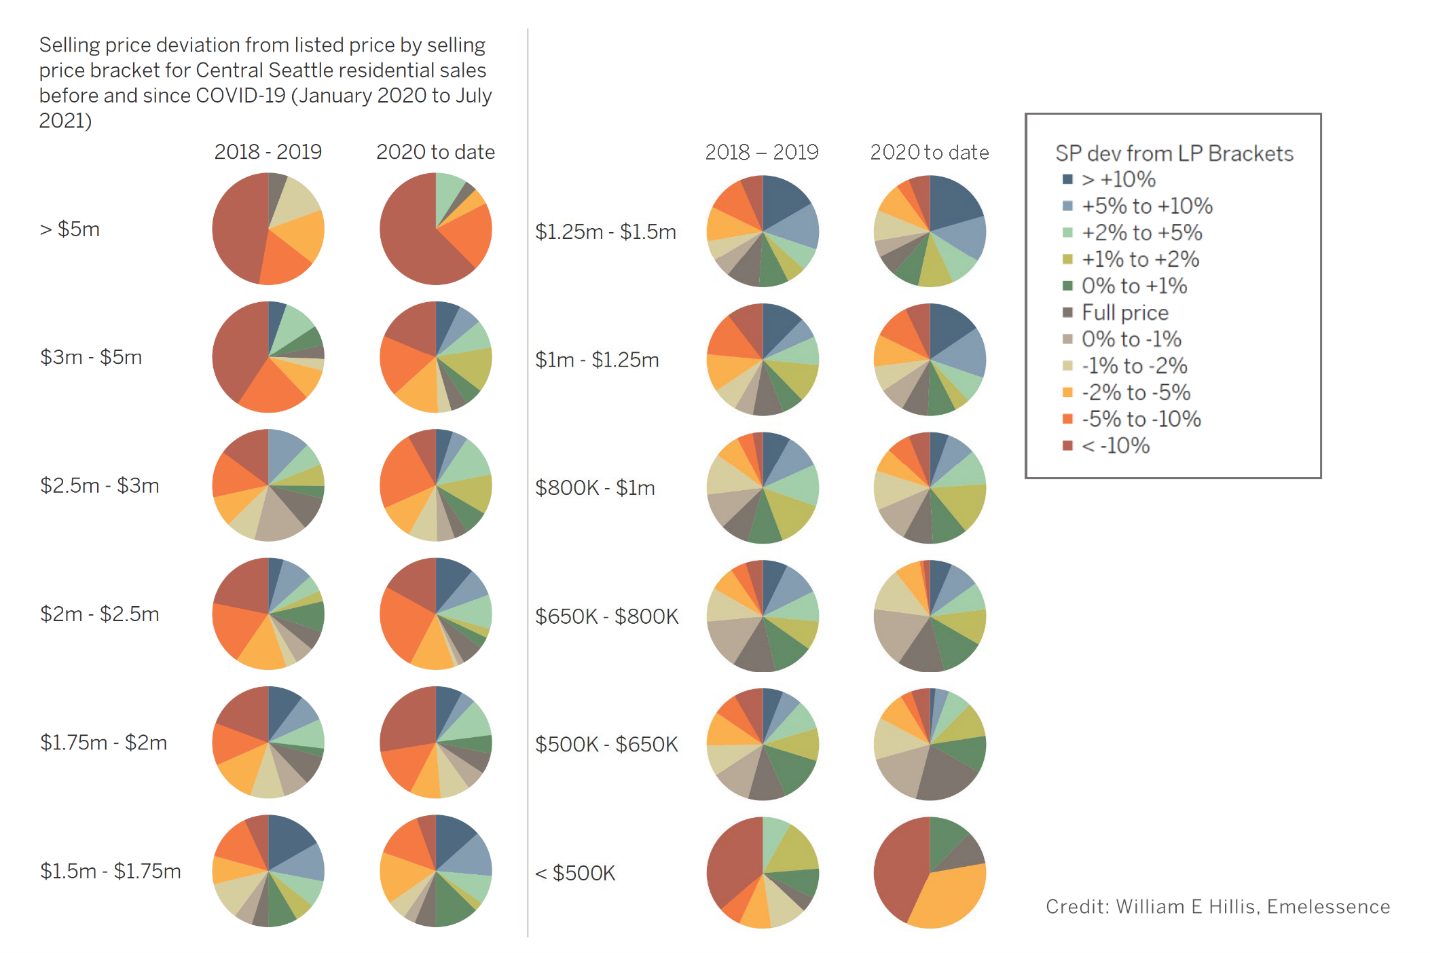
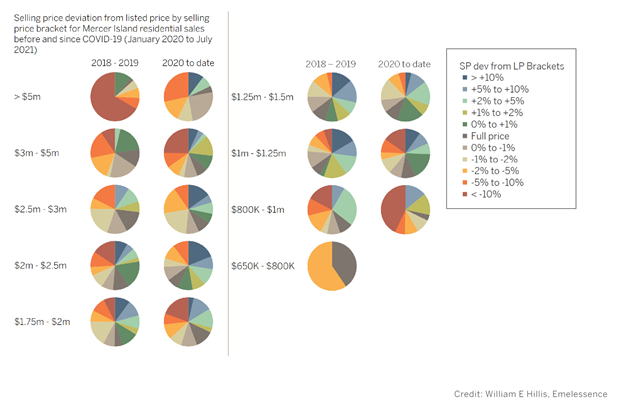
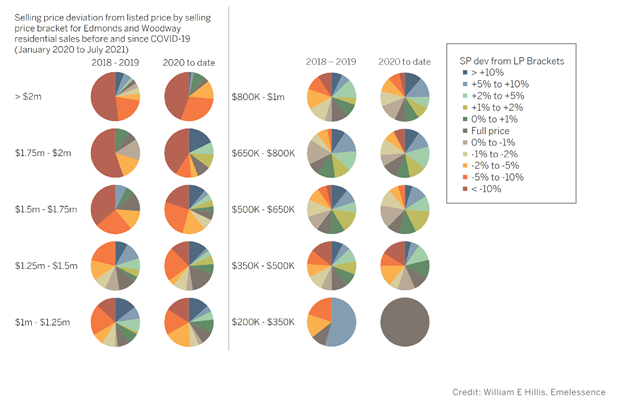
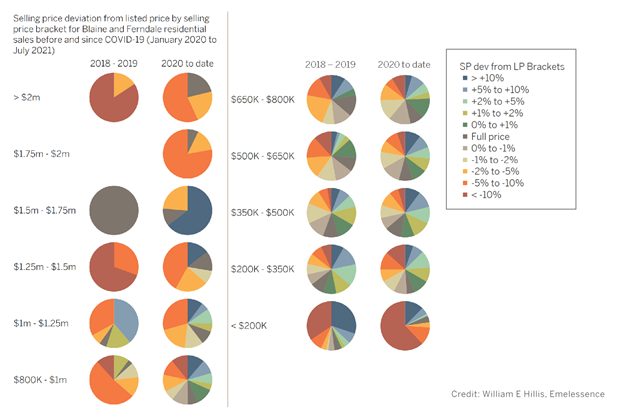
We have broken out residential selling price deviation by selling price brackets in five communities around Puget Sound: Central Seattle (including Madison Park, Capitol Hill, Denny Blaine, Madrona, Broadmoor, Madison Valley, Central District, and Judkins Park); Mercer Island; Edmonds and Woodway; Blaine and Ferndale; and North Whidbey Island (Oak Harbor and Coupeville). What we found was that while buyer competition was universal among the center price brackets, proportionally more urban sellers in the higher price brackets were required to reduce their prices, while sellers further out found buyers in higher price brackets than previously seen.
Central Seattle
Buyer competition drove prices higher in Central Seattle, but mostly at intervals between $650,000 and $1.75 million. Among higher price brackets, buyers were generally in charge, except for homes priced between $2.5 million and $3 million.
Chart D: Central Seattle selling price deviation by price bracket
Mercer Island
Prices between one and three million dollars provided the greatest satisfaction to Mercer Island sellers. But higher brackets also met with more competition than Central Seattle listings. Even sellers with offerings above five million dollars were better rewarded after COVID struck than before, in contrast with Central Seattle sellers.
Chart E: Mercer Island selling price deviation by price bracket
Edmonds and Woodway
From $500,000 to a million dollars, seller aims were usually met or exceeded at Edmonds. While this was not as often the case at higher listing prices, the appearance of higher bids on homes priced between $1.25 and $2 million indicates that new money had entered the market.
Chart F: Edmonds and Woodway selling price deviation by price bracket
Blaine and Ferndale
Starting in 2020, the few sellers offering residential homes around Blaine for sale at prices above $1.25 million began to see bidders willing to compete for these listings. Meanwhile, competitive bidding at prices below a million dollars has been more frequent than before.
Chart G: Blaine and Ferndale selling price deviation by price bracket
North Whidbey Island
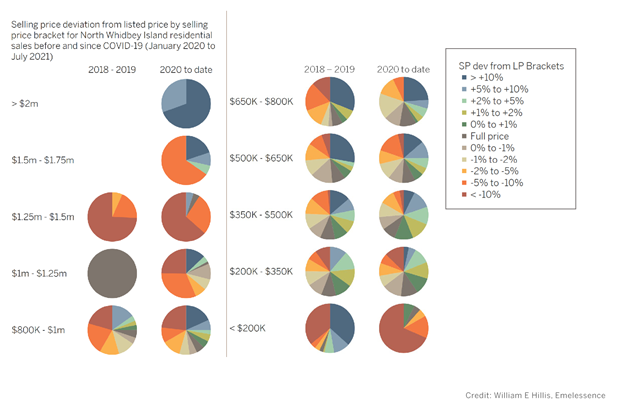
In Oak Harbor and Coupeville, sellers of homes priced between $350,000 and $800,000 were more likely than before to have their expectations met; but bidders also appeared to drive prices higher in brackets all the way up to and over two million dollars.
Chart H: North Whidbey Island selling price deviation by price bracket
Where the money goes, home prices rise
Another effect of the past year’s events which would manifest as a higher Case-Shiller price index result would be intraregional home equity transfers. While the sales of higher value homes are one potential cause of rising home price index results, another is the consequence of urban homeowners transferring their accumulated equity to homes in suburban and exurban towns within the metropolitan statistical area. These urban sellers are likely to compete against local buyers in those areas, bidding their prices higher. As long as those locations are within the boundaries of the MSA, the resulting higher prices contribute to index growth just as prices paid in the city do—another way in which urban cash-outs result in more rapid index growth for the Seattle MSA.
Condominium selling price deviation by price bracket
Now a word about condominium sales—excluded from the Case-Shiller index, but perhaps relevant to our analysis in this report.
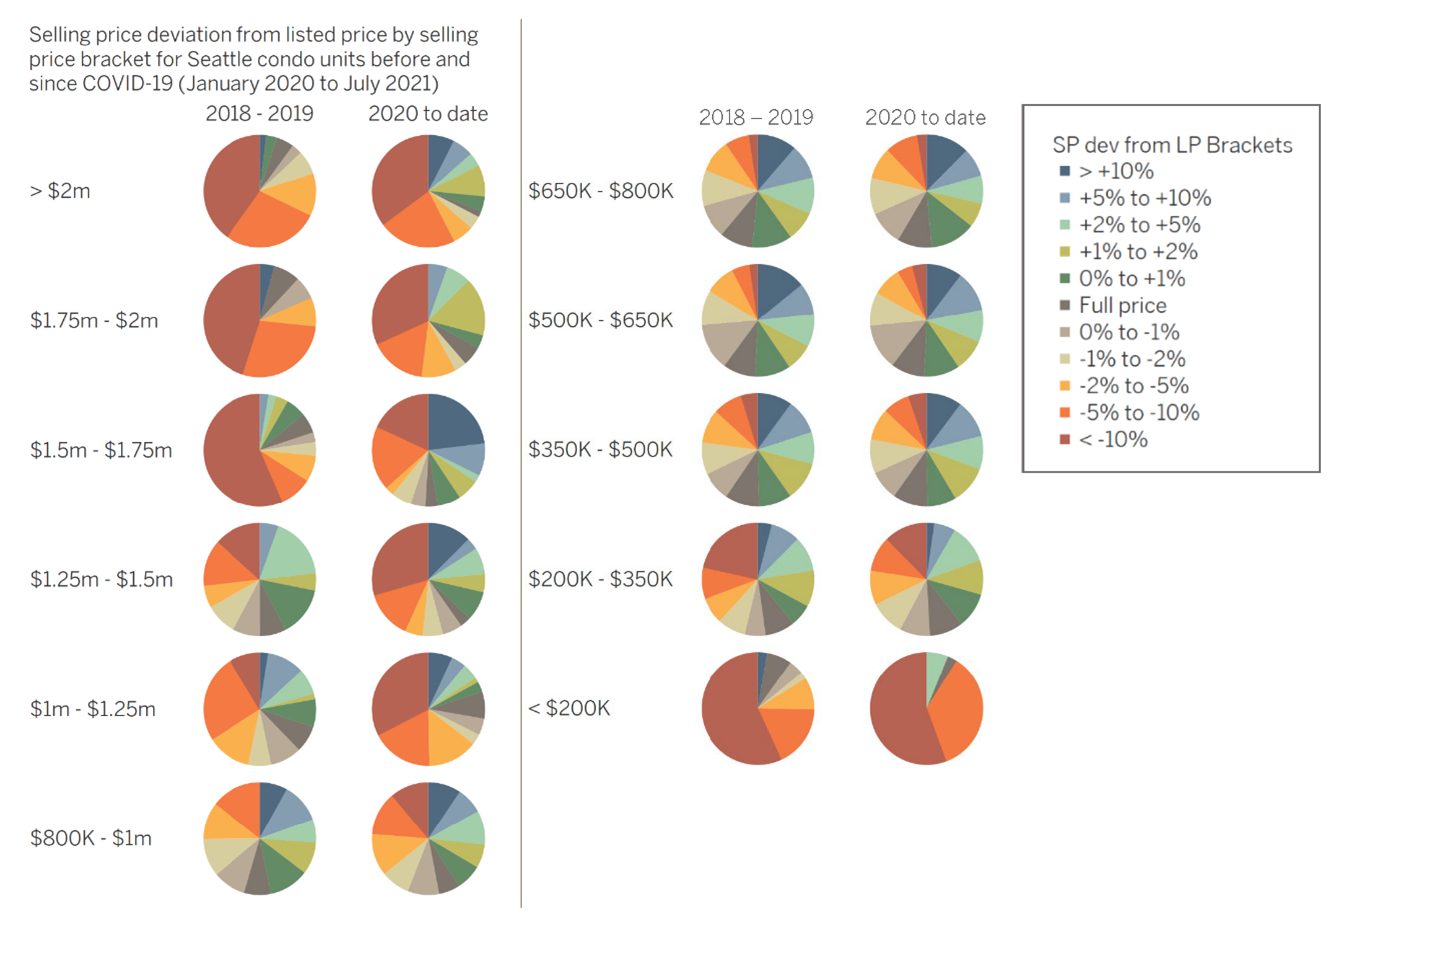
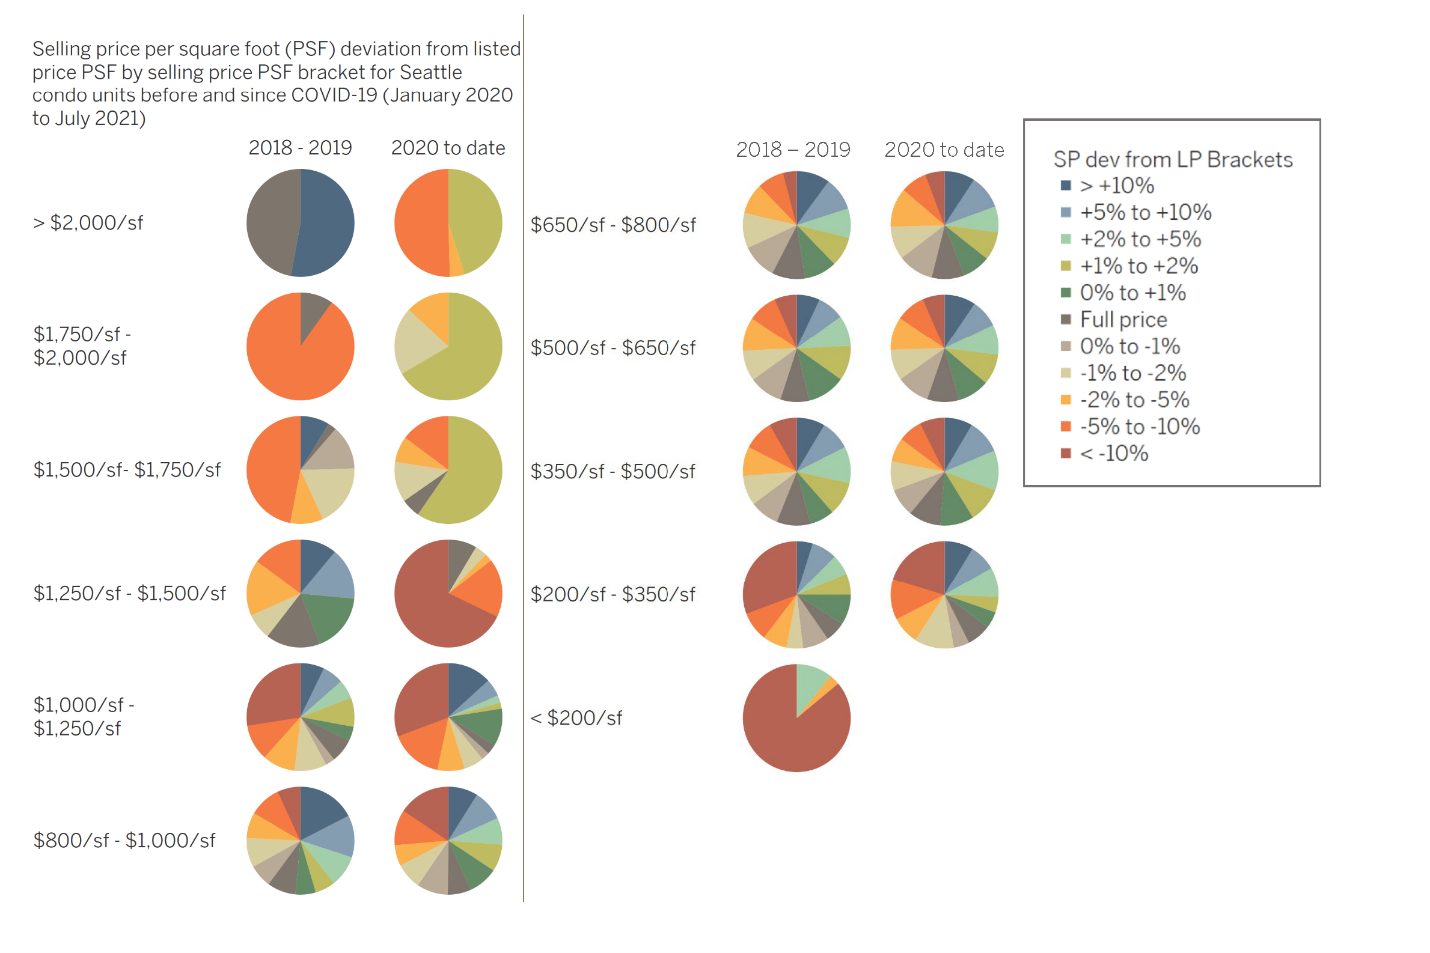
Condominium units attract buyers who are both scaling up into the homeowners’ market from rentals, and others later in life who are downsizing from larger residential homes. The high-end condo market draws second home and pied-à-terre buyers. These kinds of buyers might have been more resistant to the incentives that some residential buyers felt last year to exit urban neighborhoods. Below is the selling price deviation by selling price brackets for condominium sales throughout the entire city of Seattle, followed by the same measure for selling price per square foot. In the city of Seattle, more sellers between $800,000 and $1.5 million, and from $1,000 to $1,500 per square foot, conceded on price to buyers. Units priced above and below this level saw more competitive bidding.
Seattle condominium selling price deviation
In the city of Seattle, a weakening seller’s position was found only in aspirational condominium unit sales priced between $800,000 and $1.5 million—and at the higher end of that range, some units saw sharp upward bidding by buyers. Units sold below these prices generally maintained the trend prior to COVID-19, while high-end units (those selling for upwards of $1.5 million) saw more competition than before.
Chart I: Seattle condominium selling price deviation by price bracket
Seattle condominium selling price deviation by price per square foot
Condo price deviation per square foots breaks out similarly to unit prices: sellers remained in control at prices below $1,000 per square foot, while buyers were more cautious about units priced from $1,000 per square foot to $1,500 per square foot.
Chart J: Seattle condominium selling price deviation by brackets of price per square foot
Dean Jones, President and CEO of RSIR, observes, “We are reminded that real estate is hyper-local, and that macro reports and generalized headlines don’t speak for all markets and price points. To listen, learn, price and sell, contact a RSIR real estate professional that lives and works in the neighborhood.”
For more details on the May 2021 Case-Shiller Index results, download the S&P Dow Jones Case-Shiller summary report.
###
[1] Published by S&P Dow Jones, the Case Shiller Index surveys resales of residential homes in the Seattle MSA. The index notably does not account for condominium sales. “S&P CoreLogic Case-Shiller Index Record High Annual Home Price Gain of 16.6% in May,” S&P Dow Jones, New York, 27 July 2021.
[2] Ibid.
[3] Stephan D. Whitaker, “Did the COVID-19 Pandemic Cause an Urban Exodus?” Federal Reserve Bank of Cleveland, 5 February 2021.
[4] “Has An Urban Exodus Occurred? Residential Environment Trends Shaping the Future of Where We Live,” Federal Home Loan Mortgage Corporation (FHLMC, “Freddie Mac”), 12 July 2021.
[5] Danny Westneat, “Seattle Shrinking? Seattleites Moved Out in Droves in 2020, Though Most Didn’t Go Far,” Seattle Times, 6 March 2021.
[6] Marijn A. Bolhuis and Judd N.L. Cramer, The Millennial Boom, the Baby Bust, and the Housing Market, University of Toronto, preliminary draft paper, 22 March 2020; Baby Boomers and the Housing Market on the Cusp of COVID-19, VOX, CEPR Policy Portal, 2 April 2020.


Leave a Reply